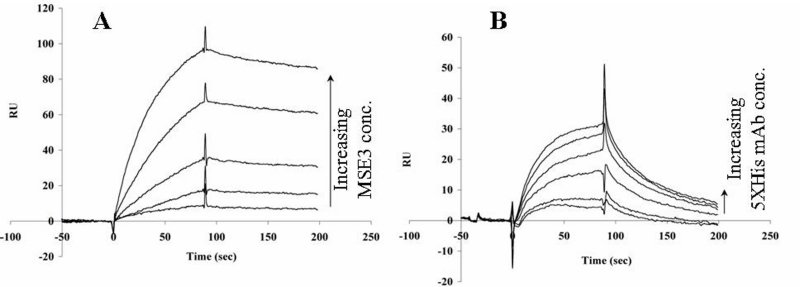
Figure 13. (A) Overlaid sensorgrams showing the binding of MSE3 to immobilized MSK2. The concentrations of MSE3 peptide were 2.5, 5, 10, 25, and 50 nm. (B) Overlaid sensorgrams for binding of Penta-His monoclonal antibody (5, 10, 25, 50, 75, and 100 nm) to captured MSE3 peptide. Data from Sergi et al. (2004).